
xG, short for expected goals, is the probability that a shot ends up in the net, scored on a scale from 0 to 1 for every attempt. Add up those probabilities across a match or season and you get a team or player's expected goal total, a baseline for how many goals the chances they created should have produced. Fans use it to separate good finishing from good luck, and coaches use it to spot patterns that raw scorelines hide. It won't tell you who wins on Saturday, but it will tell you who's been getting the better chances.
TL;DR:
- Most xG models are based on datasets nearing one million shots, allowing for subtle distinctions between close probability values like 0.28 and 0.31.
- Different providers can assign varying xG values to the same shot due to differing inputs, training data, and modeling techniques.
- Managers and scouts primarily use xG over extended periods to identify genuine talent and sustainability, not single-match statistics.
- xG metrics such as xGOT, xA, and xGA help analyze shot accuracy, assist quality, and defensive chances separately from goal outcomes.
- xG has inherent flaws, including lack of standardization, difficulty modeling chaotic play, and inability to fully judge shooter skill or luck variance.
Table of Contents
- What Is xG in Soccer? A Definition With a Worked Example
- How Is xG Calculated? Data, Models, and Why Providers Disagree
- xGOT, npxG, xA, xGA, xGD: Reading the Rest of the Alphabet Soup
- How to Actually Use xG When You're Watching a Match
- Where xG Falls Short: Criticisms Worth Taking Seriously
- What Do 0.05, 0.2, and 0.79 Actually Mean?
- How Clubs and Analysts Actually Use xG
- Why This Explanation Holds Up
- An Editorial Take: xG Is a Teaching Tool, Not a Trophy
- Track These Stats Live With Athlo
- Where These Numbers Come From
- Sources
- FAQ
What Is xG in Soccer? A Definition With a Worked Example
Every shot in soccer carries a probability of becoming a goal, and that probability is what xG measures. A tap-in from two yards out might carry a value of 0.9. A speculative strike from 30 yards might sit at 0.02. Nothing in between is guaranteed, which is the whole point: xG is a statement about likelihood, not destiny.

Think of it the way you'd think about a weighted die. If a model says a shot has a 0.3 xG, that means shots like it, from that spot, that angle, under that pressure, go in about 30% of the time across a large sample. Any single shot either scores or it doesn't. The value only makes sense as a repeatable average.
Here's how it stacks up over 90 minutes. Say a team takes three shots: one worth 0.05 xG (a low-percentage look from distance), one worth 0.15 (a decent chance from the edge of the box), and one worth 0.6 (a clean look inside the six-yard box). Add them up and that team finishes the match with 0.8 xG. If they scored one goal on those three shots, they roughly matched expectation. If they scored zero, they underperformed. If they scored two, they got hot.
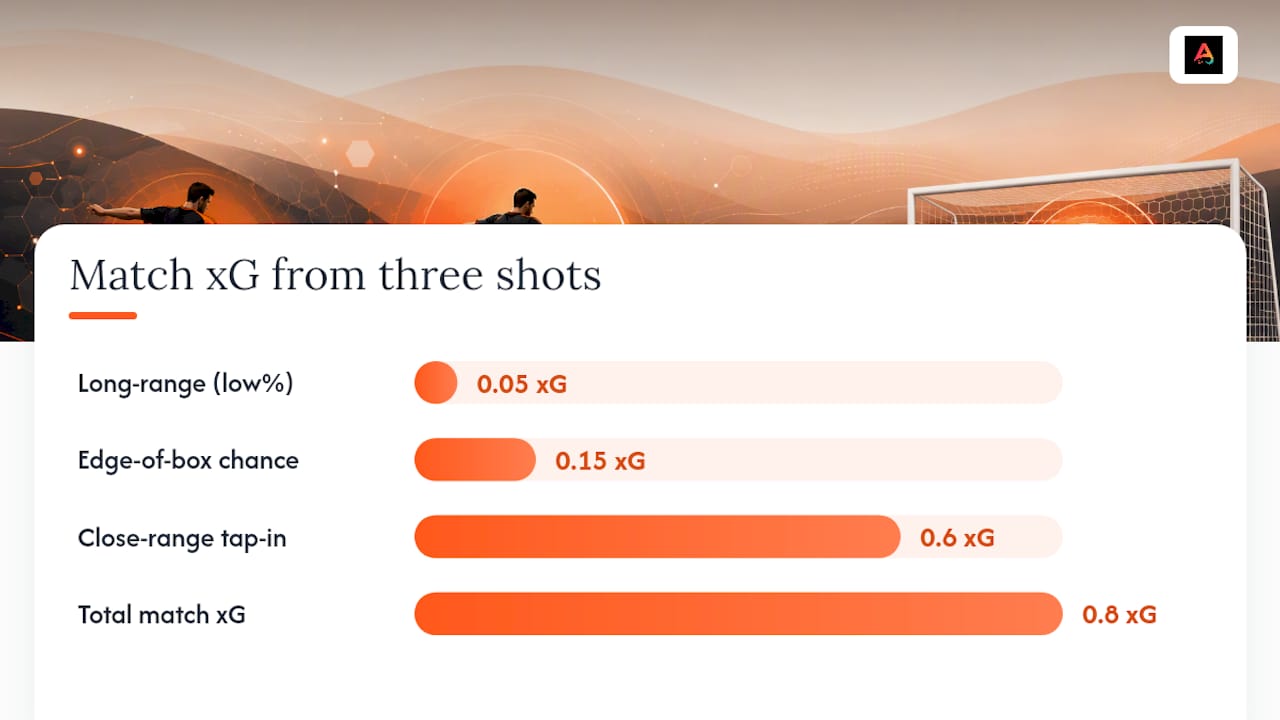
That 0.8 doesn't predict "they should have scored 0.8 goals" in any literal sense. It's an estimate of quality, not a scoreboard.
How Is xG Calculated? Data, Models, and Why Providers Disagree
Every xG model starts with a shot, then asks a series of questions about that shot before assigning it a probability. The most common inputs include:
- Distance from goal
- Shot angle relative to the goal mouth
- Body part used (foot, head, other)
- Type of assist or pass that created the chance (through ball, cross, cutback, rebound)
- Defensive pressure at the moment of the shot
- Goalkeeper positioning
Providers building these models typically fall into two camps. Some rely purely on event data, the recorded facts of what happened (shot location, assist type, outcome). Others layer in positional or tracking data, which captures where every player on the field was standing at the moment of the shot. Tracking data tends to produce sharper models because it can account for how many defenders were between the shooter and the goal, not just where the shooter stood.
On the modeling side, older systems leaned on logistic regression, a straightforward statistical method that weighs each input and spits out a probability. Newer systems increasingly use machine learning approaches like XGBoost, which can pick up on more complex interactions between variables. Either approach needs a large, clean training set to produce stable, well-calibrated numbers.

Statistic Callout: Modern xG models, including Opta-style implementations, are trained on datasets approaching one million historical shots. That scale is what allows a model to distinguish, with some confidence, between a 0.28 xG shot and a 0.31 xG shot rather than just guessing in the dark.
This is also why two data providers can look at the exact same shot and hand it two different xG values. Different inputs, different training data, different math, different number.
xGOT, npxG, xA, xGA, xGD: Reading the Rest of the Alphabet Soup
Once you understand base xG, the related metrics start making a lot more sense. Each one isolates a different question.
- xGOT (expected goals on target): calculated after the shot is struck, based on exactly where it crossed the goal line. A shot curling into the top corner scores higher xGOT than one blasted straight at the keeper's chest, even if both had similar pre-shot xG. This separates shooting precision from shot selection, and it's also how analysts credit a great goalkeeper save.
- npxG (non-penalty xG): the same metric with penalty kicks stripped out, since penalties are converted at a much higher and more consistent rate than open-play shots and would otherwise inflate a player's numbers.
- xA (expected assists): the probability value of the shot a pass created, crediting the passer for setting up a good chance regardless of whether it went in.
- xGA (expected goals against): the flip side of team xG, measuring the quality of chances a defense allows.
- xGD (expected goal difference): team xG minus xGA, a single number for overall performance that plays the same role goal difference plays in the standings, just built on chance quality instead of final scores.
Want to judge a striker's shot selection? Look at npxG. Want to judge a back line? Look at xGA.
How to Actually Use xG When You're Watching a Match
Reading xG well is less about memorizing formulas and more about knowing what question you're asking. Here's a simple approach:
- Compare goals to xG over a run of games, not one match. A striker who's scored 8 goals from 4.5 xG over five matches is running hot. That's worth watching to see if it holds up or regresses.
- Use season-length samples before drawing conclusions. A single match's xG can be skewed by one deflected shot or a wonder strike from 25 yards. A full season smooths that out.
- Check xGA and "xG prevented" to judge goalkeepers and defenses. A keeper who consistently allows fewer goals than their xGOT suggests they've earned is outperforming the shots they're facing.
- Note which provider's numbers you're looking at. Two broadcasts can show different xG totals for the same match because they're pulling from different models.
Pro Tip: Before you argue about a stat line, check the sample size. A team's "elite 2.1 xG per game" pace over three matches means almost nothing. Over 20 matches, it starts to mean something.
Where xG Falls Short: Criticisms Worth Taking Seriously
xG is useful, but it isn't gospel, and pretending otherwise gets fans (and analysts) into trouble.
- No standardization. Because xG implementations differ by data source and modeling choice, the same shot can carry different values on different platforms, and model quality is really judged by discrimination and calibration, not by matching some universal "true" number.
- Small samples are noisy. One match, or even five, can be dominated by variance. A team can rack up 2.5 xG and lose 3 to 0 because the finishing gods had other plans that night.
- Shooter skill isn't fully captured. Most models weight the shot situation heavily but can't fully account for a player who's simply a better finisher than average.
- Chaos plays don't fit neatly. Rebounds, scrambles, and deflected set pieces are harder to model cleanly than a clean run at goal.
- Don't fall for the gambler's fallacy. A team "due" for a goal after a run of bad luck isn't owed anything by the universe. Regression toward the mean is real, but it's a statistical tendency, not a promise.
What Do 0.05, 0.2, and 0.79 Actually Mean?
Numbers stick better with a reference point, so here's the cheat sheet.
- 0.05 xG: roughly a 5% chance of scoring, the kind of value assigned to a tight-angle shot or a strike from well outside the box. Miss 19 of these in a row and you're right on schedule.
- 0.2 xG: about a 20% chance, typical of a shot from the edge of the penalty area with a defender closing in. Good chance, far from a lock.
- "Big chance": most trackers reserve this label for shots in the 0.3 to 0.4-plus range, usually a clear look inside the box with minimal pressure.
- Penalty xG: fixed by most providers at around 0.79, reflecting how consistently penalties get converted compared to open play, which is exactly why analysts strip them out for npxG.
Picture a striker cutting inside the box under light pressure (roughly 0.35 xG) versus a teammate shooting from 28 yards with a defender in the passing lane (roughly 0.04 xG). Same match, wildly different value.
How Clubs and Analysts Actually Use xG
Front offices didn't adopt xG because it's a fun stat for broadcasts. They adopted it because it changes decisions.
Scouting departments use it to separate a striker who's genuinely creating high-quality chances from one who's simply on a hot scoring streak that will cool off. A winger with strong xA numbers is setting teammates up for good looks even in a stretch where the final ball isn't landing in the net. On the defensive side, coaches lean on xGA to find where a shape is leaking quality chances, sometimes spotting a tactical hole a highlight reel would never reveal, like a fullback consistently caught upfield when the opponent counters.
Recruitment staff track season-long xG and npxG trends to project whether a signing's output is sustainable or a fluke of a lucky run. Clubs comparing goals to xG this way can flag both breakout talent and players riding an unsustainable hot streak before the market catches on.
None of this happens in isolation from old-school scouting, though. Clubs pair proprietary tracking data with actual eyes on the player, because a model can't watch a kid's work rate in the 85th minute of a scoreless game.
Why This Explanation Holds Up
The numbers in this piece aren't guesswork. Modern xG models draw from datasets approaching one million recorded shots, which is what lets a model tell the difference between a 0.28 and a 0.31 xG chance with any real confidence. The logistic regression and machine learning approaches described above are the same families of models the major data providers actually run in production, not simplified stand ins.
If you want to see these numbers play out in real time, an app like Athlo tracks live scores, stats, and AI-driven match insights, giving fans a hands-on way to watch xG and other advanced numbers develop as a game unfolds. Check it out at Athloapp.
An Editorial Take: xG Is a Teaching Tool, Not a Trophy
Here's what gets lost in most xG debates: the number was never built to end arguments, it was built to sharpen them. Watching a youth game and seeing a kid create three high-value chances with no goals to show for it teaches you something raw scorelines never will, that shot selection and quality of movement often matter more than the final bounce.
The mistake casual fans make is treating xG like a verdict instead of a lens. Use it to ask better questions: why is this team creating so many low-value shots, why does this keeper keep beating their xGOT. Use it to notice patterns before the goals catch up, whether you're watching a Premier League match or a Saturday morning rec league game.
That's the whole value of the stat. It rewards patience over hot takes.
— Abdulazeez
Track These Stats Live With Athlo
Reading about xG is one thing. Watching it update shot by shot during an actual match is another. Athlo gives fans and youth athletes a single hub for live scores, AI-driven match insights, and stats as games unfold, without digging through five different broadcast graphics to find them.

Beyond the live tracking, Athlo also connects players and families to pickup games through LinkUp, a coaching marketplace, for booking sessions, and event tickets with QR entry, for local games and tournaments. If you're a player, parent, or coach who wants match stats and community features in one place instead of scattered across five apps, download Athlo on the App Store or Google Play and set up your profile before your next game.
Where These Numbers Come From
- Annals (Yonsei) breaks down xG model inputs and dataset scale.
- The Analyst explains Opta-style model variables and how to interpret expected value.
- Wikipedia's Expected Goals entry covers why implementations vary across providers.
- FBref details xGOT and standard penalty xG treatment.
Sources
- Annals (Yonsei) — explanation and dataset notes on xG models
- The Analyst — What is expected goals (xG)?
- Wikipedia — Expected goals
FAQ
Is Higher or Lower xG Better?
Higher xG is better when you're the team creating the chances, since it means you're generating higher-quality shots. Lower xG is better when you're the team defending, since it means you're limiting your opponent to lower-value looks.
Why Is xG Flawed?
xG isn't standardized across providers, so the same shot can get different values depending on the model, and it struggles to fully capture shooter skill, rebounds, and chaotic set pieces. It's a strong tool for context, not a perfect predictor.
What Does 0.05 xG Mean?
A 0.05 xG shot has roughly a 5% chance of scoring, typical of a long-range strike or a shot from a tight angle.
What xG Is Considered a Big Chance?
Most trackers label a shot a "big chance" once it reaches roughly 0.3 to 0.4 xG or higher, usually a clear look inside the box with little defensive pressure.
How Does Penalty xG Work?
Penalties get a fixed xG value, commonly around 0.79, because their conversion rate is far more consistent than open-play shots. That's why non-penalty xG (npxG) exists as a separate stat.