
NFL advanced stats quantify what a box score can't: how much credit a player deserves for a play once you strip out game context, opponent quality, and pure luck. Fans use them to argue smarter, analysts use them to build models, and fantasy players use them to catch a breakout before the waiver wire catches on. This guide covers the core metrics, where the numbers come from, and how to actually put them to work.
TL;DR:
- Advanced stats focus on efficiency and value creation, such as EPA and CPOE, rather than just raw totals like yards or touchdowns.
- Metrics like RYOE and Stuff Rate reveal the true effectiveness of run plays and offensive line performance beyond what box scores show.
- Reliable data sources update frequently within a few days after games, and exports in CSV or JSON are essential for accurate analysis.
- Combining usage indicators like target share with efficiency metrics helps identify breakout players or overperforming teams before market pricing adjusts.
- Simple tracking tools at youth or local levels can leverage advanced concepts like expected yards and pressure to enhance coaching decisions without complex software.
Table of Contents
- Why NFL Advanced Stats Matter Beyond the Box Score
- What Do EPA, CPOE, and Other Advanced Stats Measure?
- Where Does NFL Analytics Data Come From?
- How Do You Actually Use Advanced Stats to Make Decisions?
- How to Read NFL Stat Leaderboards Without Getting Fooled
- Bringing Advanced-Stat Thinking to Youth and Local Football
- An Editorial Take on Weekly Stat Priorities
- Track Your Own Game With Athlo
- Sources
- FAQ
Why NFL Advanced Stats Matter Beyond the Box Score
A running back with 100 yards on 25 carries looks identical to one who got there on 10 explosive runs and 15 stuffed ones. Advanced stats separate those two backs instantly. Traditional stats measure volume. NFL analytics measure efficiency, which is a different question entirely: not "how much did you do" but "how much value did you create relative to expectation."
That distinction matters most in places the box score can't see:
- Offensive line push that opens (or closes) running lanes before the back touches the ball
- Route separation created against man versus zone coverage
- Pressure a quarterback faces that never shows up as a sack but still wrecks a throw
- Situational tendencies, like how a defense performs on third-and-short versus third-and-long
Coaches use these numbers for game-planning, front offices use them for roster and draft evaluation, bettors use them to find pricing gaps in the market, and fantasy managers use them to find the player about to break out before their price catches up with the help of AuksPort's football intelligence platform. Once you start reading football this way, box-score wins and losses start to look like the least interesting part of the game.
What Do EPA, CPOE, and Other Advanced Stats Measure?
Every advanced metric tries to answer one question: was this play good, adjusted for the situation it happened in? Here's the working glossary you actually need.
Expected Points Added (EPA) measures how much a single play changed a team's scoring expectation, based on down, distance, and field position. A 4-yard gain on 3rd-and-3 adds real value; the same 4 yards on 3rd-and-10 adds almost none. EPA is built on expected value, the same statistical logic that underlies win probability models across sports.
Completion Probability and CPOE (Completion Percentage Over Expected) judge a quarterback's accuracy against the difficulty of each throw, not just the raw completion rate. Next Gen Stats generates completion probability from player-tracking data, factoring in throw distance, receiver separation, and pressure at the time of release.
Rush Yards Over Expected (RYOE) and Stuff Rate do for the run game what CPOE does for passing: RYOE credits a back for yards beyond what the blocking should have produced, while Stuff Rate tracks how often a run gets stopped at or before the line, exposing weak run defenses and shaky offensive lines that raw rushing totals hide.
A few more worth knowing:
- Pressure rate and sack rate flag offensive line trouble even in weeks a quarterback avoids getting sacked
- Air yards measure how far downfield a pass travels in the air, separate from yards after the catch
- Target share shows how big a piece of the passing offense a receiver actually commands
- Yards after catch (YAC) isolates a receiver's or back's playmaking once the ball is in hand
Quick reference: Offense-side metrics (EPA, CPOE, RYOE, air yards, target share) tell you who's producing. Defense and trench metrics (Stuff Rate, pressure rate) tell you who's getting beat. Read both sides before drawing a conclusion about either.
Where Does NFL Analytics Data Come From?
Two data streams feed almost every advanced stat you'll see: player tracking and play-by-play logs.
Player tracking, the technology behind Next Gen Stats, records every player's X and Y position on the field multiple times per second. That frame-level data is what makes speed, acceleration, and separation metrics possible, since you can't calculate how open a receiver was without knowing exactly where every defender stood at the moment of the throw.
Play-by-play feeds are simpler: down, distance, yard line, play result, and personnel, logged for every snap. EPA, success rate, and most efficiency metrics are derived from this layer rather than raw tracking coordinates.
If you're building your own models instead of just reading leaderboards, prioritize sources that export in CSV or JSON. Raw exports let you construct custom routes, rolling averages, and matchup-adjusted indices instead of relying on someone else's pre-built formula.
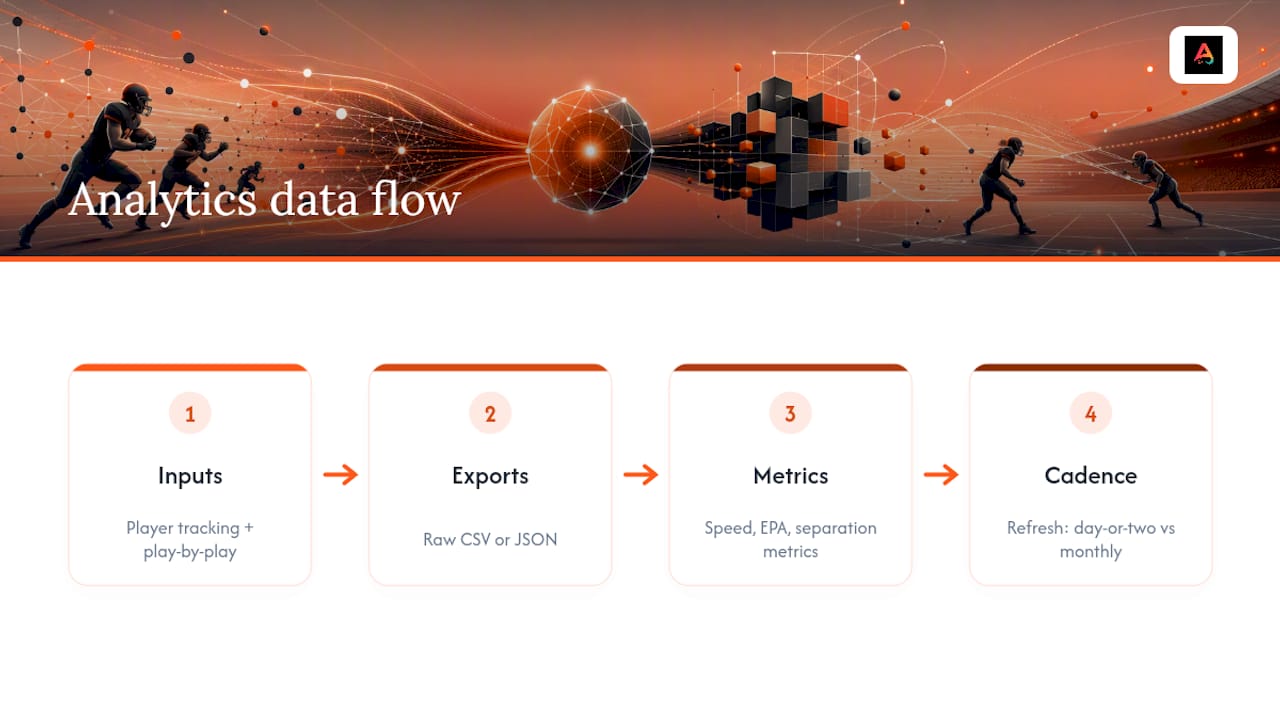
Pro Tip: Before you trust any advanced stat, check its update cadence. A site that refreshes leaderboards within a day or two of each game window is working with current data; one that only updates monthly is showing you last month's version of a player.
How Do You Actually Use Advanced Stats to Make Decisions?
Knowing what EPA means doesn't help if you never turn it into a call. Here's how three different readers apply the same pool of numbers.
-
Fantasy players: hunt opportunity before efficiency catches up. Cross-reference a receiver's target share with their air yards and routes run. A player seeing a significant portion of the target share and heavy downfield volume but modest fantasy points is usually poised for a breakout week, not a fluke about to fade.
-
Analysts and scouts: separate the quarterback from the offensive line. Pair a quarterback's completion probability under pressure with the team's pressure rate allowed. A QB whose numbers hold up when pressured is a different evaluation than one who's only good in a clean pocket. This is also where Stuff Rate earns its keep. Combine it with Power Success Rate to judge whether a struggling run game is a scheme problem or a personnel problem.
-
Bettors: test whether the market has priced in pace and situational tendencies. Compare a team's plays-per-game and third-down conversion rate against the game total the sportsbook has posted. A fast, efficient offense facing a defense that's poor on early downs often signals more scoring than the line suggests.
The common thread across all three: never lean on one number alone. Pairing usage with efficiency, as analysts who track Stuff Rate and similar metrics generally recommend, cuts down on false positives, whether you're chasing a fantasy sleeper or a betting edge.
How to Read NFL Stat Leaderboards Without Getting Fooled
Not every leaderboard deserves your trust. Before you build a lineup or a model around a number, run through this checklist:
- Update cadence: Reliable sources refresh within a few days following games ending; anything older is stale by the time you use it.
- Column glossary: If a site can't tell you exactly how it calculates EPA or CPOE, you can't verify the number is comparable to another source's version of the same stat.
- Export options: A page offering CSV or JSON downloads is built for people doing real analysis, not just casual browsing.
- Sample size flags: Watch for small-sample outliers, like a receiver leading a category after two catches in one game.
- Aggregation red flags: Season-long averages that don't update weekly are usually stitched together from older snapshots, not live-tracked.
Pull a sample CSV before you trust it. Open the column headers first and confirm the stat definitions match what the site claims, since two sources can both call something "EPA per play" and calculate it slightly differently.
Bringing Advanced-Stat Thinking to Youth and Local Football
You don't need an NFL analytics department to apply this thinking at the high school or pickup level. Simple tracking, like who's actually touching the ball and how efficiently, tells a coach or parent more than a final score ever will. Athlo's live scores and heat maps give coaches and families a lightweight way to spot per-player trends without building a spreadsheet from scratch.
An Editorial Take on Weekly Stat Priorities
Skip the 40-tab spreadsheet. Check target share (or opportunity share) and EPA per play first; together they separate real workload from empty stats. Cross-reference the two before making a call. Everything else is noise until those two agree with each other.
— Abdulazeez
Track Your Own Game With Athlo
Reading NFL analytics is one thing. Having a place to track your own team's stats without a spreadsheet is another. The app gives coaches, parents, and players a real edge here: instead of guessing at who's actually producing in a Saturday morning game, you get live scores, heat maps, and AI-driven insights that turn a messy scoresheet into something you can actually read.

If you're organizing pickup games, Athlo's LinkUp feature helps you find and host local games with QR-code check-in, so you're not chasing down who showed up or who owes what. Coaches looking to turn their expertise into income can list sessions through Athlo's coaching marketplace, with secure in-app payments handling the awkward money conversation for you. Download Athlo on the App Store or Google Play and see your own team's numbers the way the pros see theirs.
Sources
For deeper technical grounding, see Next Gen Stats on player tracking, the Vanderbilt Data Science overview of the Big Data Bowl, and Action Network's explainer on Stuff Rate.
- Stuff Rate definition and how to use it - Action Network
FAQ
What Are Some Advanced Stats for the NFL?
The essentials are EPA, CPOE, RYOE, Stuff Rate, target share, air yards, and pressure rate. Each measures efficiency or context rather than raw counting totals like yards or touchdowns.
What Are Advanced Stats in Football?
Advanced stats adjust raw production for situation, opponent, and difficulty, answering "how good was this performance" instead of just "how much did it total." They're built from play-by-play logs and player-tracking data rather than final box scores.
What Is the Best Website for Advanced Football Stats?
No single source covers everything, so check a site's update cadence, published glossary, and export options before trusting its numbers for fantasy or betting decisions. Sites that refresh within a day or two of game action and explain their formulas are the most reliable.
Who's Richer, Peyton Manning or Tom Brady?
Career earnings and net worth estimates for both quarterbacks vary by source and aren't tracked through NFL performance data, so this guide doesn't cover financial comparisons. Advanced stats measure on-field production, not off-field wealth.
How Often Do NFL Advanced Stat Leaderboards Update?
Most reliable sources refresh within a few days after games finish, with full season totals typically updated on a weekly basis. Always check a site's own stated cadence before relying on its numbers for weekly decisions.